
Bitcoin continued to decline over the weekend under pressure from…yes, almost from all sides.

This graph is a headache , with one of the more dubious weekly candles I can think of. After a fairly confident movement towards $45 thousand, bitcoin pulled back strongly, closing the week almost at the opening level. The shape of the candle resembles a “tombstone doji”, but in fact, everything is not as bad as it seems. Context is important. The tomb (or grave) doji only matters at the top, indicating depletion of demand and the possibility of a price reversal. At the lows, such a candlestick can be considered more like a bullish one. At the moment, the market is in a sideways trend at all, so I do not want to attach much importance to such a close. I will only note that the price action during this period looks completely disorienting and can probably beat even the most experienced traders pretty much.
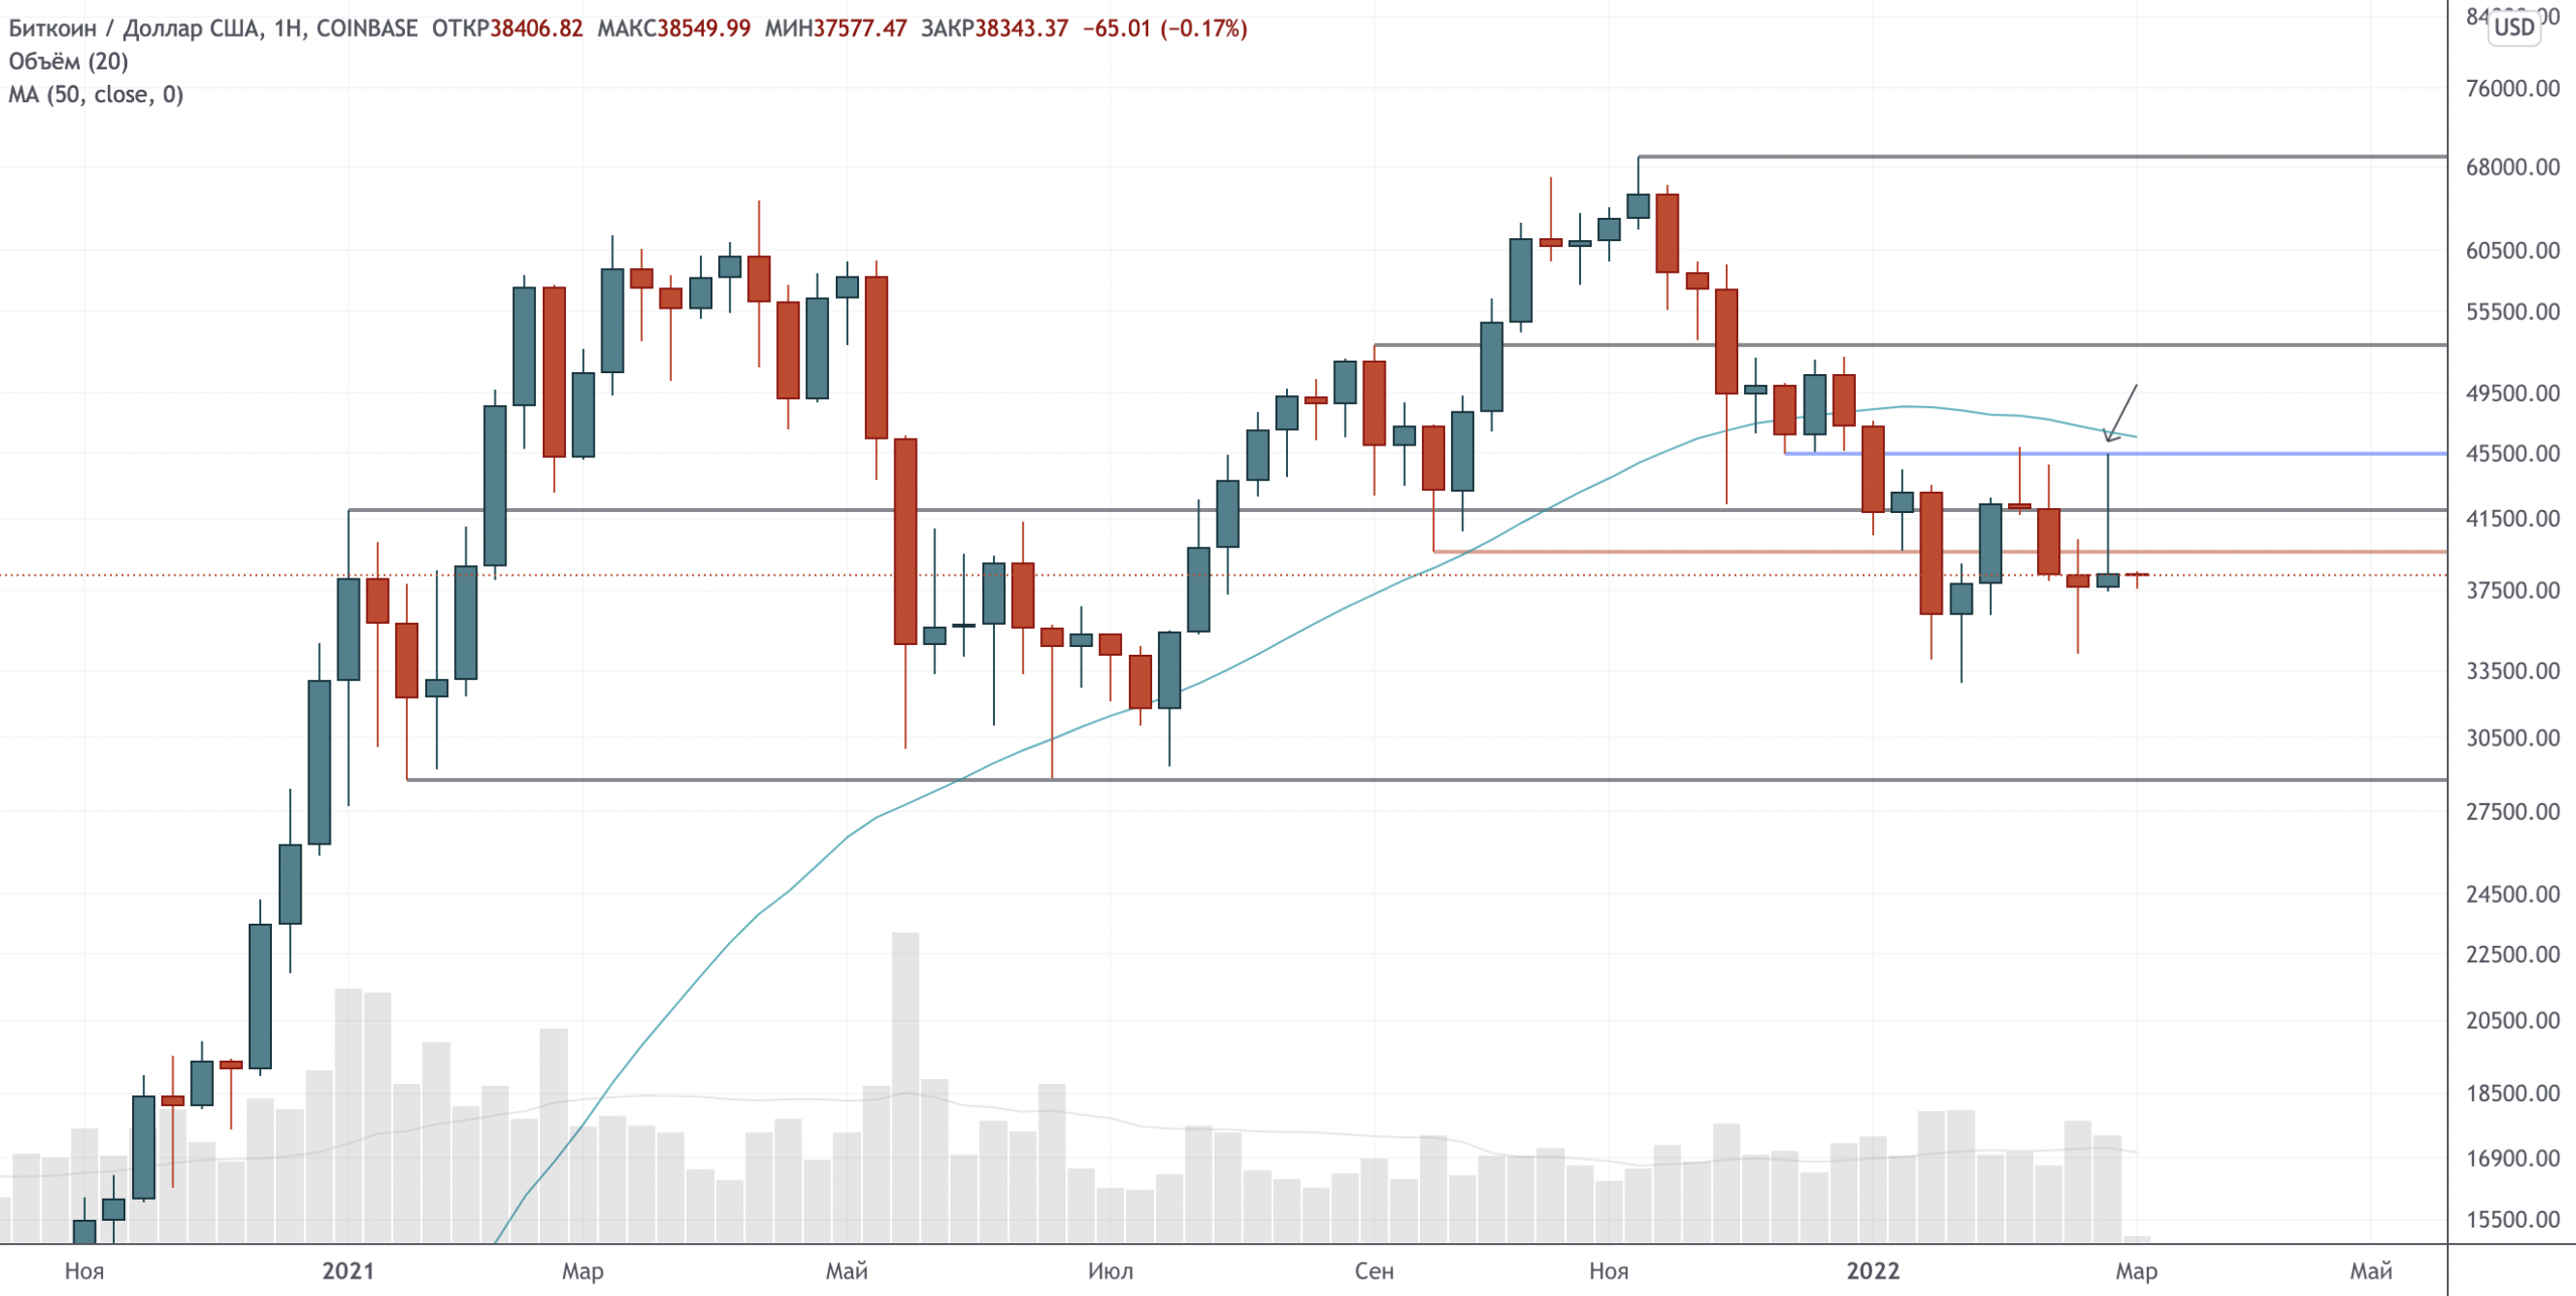
Daily chart

Recover above $,6 thousand, 50 MA and $42 thousand only to lose them all again in one daily candle – it’s discouraging. The current area should offer some support judging by the cluster formed by the price to the left, but this chart is also quite difficult to interpret convincingly.
4-hour chart
On the 4-hour chart, the price confirmed a miniature bullish divergence with the RSI from the oversold zone. This is one of my favorite reversal signals and that’s why I haven’t closed my long yet. The 6-hour chart is also close to confirming the same divergence, but not from “oversold”.
But it is important to remember that such divergences often form. Take a look to the left of the chart and you will see several small divergences, after which the price continued to decline before confirming a larger divergence. overbought or oversold. You can rewind the graph back at least for  years – the picture will be the same (did not draw, sorry).
There are two examples (X) on the chart where the RSI was overbought or oversold and did not diverge with the price. In the first case, the price then continued to decline, the second is the last local maximum.
It is also important to note that a confirmed bullish divergence on the 4-hour timeframe does not cancel the likelihood of a latent bearish divergence following it. , if we do not see a significant upward movement – above $39, 6 thousand or so. This development is likely to mean further declines and likely the formation of a larger bullish divergence at some point.
Traditional markets
CL1! (light oil futures)
When critics tell you that bitcoin is too volatile, remind them that the price of a barrel of oil has dropped to negative values less than two years ago, and now exceeded $65 before pulling back slightly.
Analysis of the relationship between price and oil production and the world economy is far beyond my personal knowledge, and even the most experienced experts disagree on what the current price increase will mean for the whole world. Looking at the chart, we can assume that now it can form a top: there is a huge gap and the candle has the potential to close as a “shooting star” (here is a weekly chart, but the picture is similar on the daily one). However, in the midst of a global crisis, the situation can develop as you like.
The main problem today is that rising oil prices can cause a global recession. There is an old rule used by the big car companies in the 805’s: if oil prices have risen by more than 42%, expect a recession.
A year ago the price was around $50, she has just reached $65. However, if the letter of this old rule is strictly followed, then the price of oil should rise by 100% and gain a foothold above this level, which has not yet happened.
Whatever it was: oil prices skyrocketed pressure on almost every industry and asset in the world. The protracted conflict in Ukraine and the expansion of sanctions against Russia are likely to only exacerbate these pressures, while a relatively quick resolution could return the situation in global markets to relatively normal.
Now the situation in the markets is crazy, be careful.
BitNews Subscribe to BitNovosti on Telegram!
disclaim any liability for any investment advice that may be contained in this article. All judgments expressed express exclusively the personal opinions of the author and the respondents. Any actions related to investments and trading in the crypto markets are associated with the risk of losing the invested funds. Based on the data provided, you make investment decisions carefully, responsibly and at your own peril and risk.
Share your opinion about this article in the comments below.
170609