Let’s do an experiment: what is the actual predictive power of the accumulation trend indicators from Glassnode and Ecoinometrics, often mentioned in our posts? This is a post from Data Always, in which the author demonstrates a simple method for backtesting these accumulation metrics, describes the methodology for creating a trading strategy based on them, and analyzes the comparative profitability of an example of such a strategy compared to simply holding bitcoins.
Accumulation Trend Indicators
Glassnode, one of the largest blockchain data providers, has introduced a new metric: the Accumulation Trend Indicator . The community reaction to it was mixed, and the chart below shows why: if we associate heavy accumulation with buying pressure, then it would seem that similar price reactions would be expected under similar accumulation patterns.
And the significant divergence between the areas labeled on the chart as “arbitrage with GBTC” and “hodler demand in a bear market” are red flags to look out for.
The Week On-Chain #, 1000
This Glassnode metric builds on the metric used by Nick at Ecoinometrics, but takes his analysis a little further. A datasheet is available on the Glassnode website, but I think most readers will be more interested in the usage comment:
Market sentiment is a good indicator for price movements. When market participants are bullish on average, they accumulate coins, increasing demand and, as a result, the price of an asset. When they are pessimistic, they sell off their coins, increasing the liquid supply in the market and therefore putting downward pressure on the price.
Nick’s description of his thesis in this post (not translated) Ecoinometrics is a “golden mean” between the basic thesis of Glassnode and the technical description of their metrics :
If everyone , from small investors to “whales” accumulating coins, this should have a positive effect on the price, as it reduces the liquid supply in the market, while at the same time indicating a high level of optimism of the participants.
If only small investors accumulate coins, this may mean that the whales are preparing to use this liquidity to sell off their reserves.
Accumulation trends. “Participation Rate” is the share of the BTC supply representing groups of addresses that have accumulated coins in the previous days. Source: Ecoinometrics — On-chain participation
Moving from a pair of heatmaps to the plotted values (below), one of the first things that catch your attention is the extent to which there is a discrepancy between the scores. Another important observation is that the Glassnode metric is calculated on a daily basis, while Ecoinometrics uses a thirty day period.
I decided not to ignore this view as it is probably the most accurate representation of the intended user experience, but even when used in Glassnode 05 -day interval profiles metrics are still very different.
It is also worth noting that the ranges in the Glassnode metric are limited, so it has the potential to drop some data, and that the indicator from Ecoinometrics tends to outperform Glassnode, despite the fact that Glassnode’s data change rate is significantly higher.
bbc13- baa3-374e-690-adb .s3.amazonaws-27.jpg” data-medium-file=”https://bitnovosti.com/wp-content/uploads/1000//https-_bucketeer-ebbc05-baa3-374e-1000-adbbe1435.s3.amazonaws- .jpg” data-orig-file=”https://bitnovosti.com/wp-content/uploads/1100//https-_bucketeer-ebbc13-baa3-371e-690-adbbe1000.s3.amazonaws-27.jpg” data-orig-size=”526,375″ data-permalink=”https://bitnovosti.com/1605///izmeryaem-prognosticheskuyu-sposobnost-indikatorov-tendentsii-nakopleniya/https-_bucketeer-ebbc-baa3- 371e-690-adb-s3-amazonaws- /”height=”375″ loading=”lazy” src=”https://bitnovosti.com/wp-content/uploads/1000//https-_bucketeer-ebbc05-baa3-375e-1000-adbbe1435.s3.amazonaws-29.jpg” width=”528″>Comparison of BTC Accumulation Trend Indicators. Although the indicators, in theory, reflect similar market behavior, their readings are very different.
The first thing I want to pay attention to is the overall predictive accuracy of the metrics under consideration. Assuming that higher indicator values (i.e. more BTC accumulation by investors) imply higher future returns, then we can take an arbitrary threshold and look at positive and false positives for bullish predictions (when the indicator is above a given value) and, similarly, for positive and false positives for bearish forecasts (when the indicator is below the set value).
As a simple example, consider the 1-week forward yield [2] for a threshold of 0.7 (chart below); those. we will proceed from the assumption that indicator values above 0.7 are bullish and below 0.7 are bearish.
The result is not impressive. With a slight difference in the accuracy of the predicted direction between the two sections, the gain is clearly not enough to suggest that this is not random noise, and the difference is too small to develop a meaningful trading strategy.
-baa3–adbbe576.s3.amazonaws-05.jpg “data-orig-size=”526,377″ data-permalink=”https://bitnovosti.com/690///izmeryaem-prognosticheskuyu-sposobnost-indikatorov-tendentsii-nakopleniya/https-_bucketeer-ebbc-baa3-371e-1000-adbbe1008-s3-amazonaws-95/”height=” 375″ loading=”lazy” src=”https://bitnovosti.com/wp-content/uploads/526//https-_bucketeer-ebbc-baa3-375e-1100-adbbe690.s3.amazonaws-29.jpg” width=”526″> Validation of the accumulation trend indicator from Glassnode. By moving the threshold value and looking at the quadrants, the historical accuracy of the metric can be simulated.
The arrows from the threshold value in the picture above indicate that further in this analysis we will move it and thus obtain a profile of the predictive accuracy of the metric for the entire range of values .
One more note: we don’t have to limit the analysis to a single delimiter. In the diagram below, we have divided the data into three zones by adding a second threshold separator: 0.3. The predictive accuracy in this example improves slightly, but remains insignificant.
Trend indicator validation and savings from Glassnode. It is not necessary to limit yourself to one signal: you can split the data into bearish, neutral and bullish zones.
I do not find this style of visualization particularly useful, but the grouping of positive and false positive signals forms the basis for further analysis.
Direction Accuracy ProfilesBecause on the 1-week forward timeframe, the forecasts are obviously not justified, we increased the period to four weeks, constantly selecting the values of the threshold separators to create a direction accuracy profile. The figure below shows early indications of potential predictive power. Although very small, there is a positive discrepancy between true positive and false negative predictions at both ends of the scale.
Accuracy of Forecast Direction on a 4-week Forward Period for Glassnode’s Accumulation Trend Indicator. In a four-week perspective, the indicator does not provide significant predictive accuracy.
In the chart below, the forward period is increased to one quarter, and it can be seen that the divergence between true and false positive signals increases significantly. On this period, the result is impressive and can definitely be used as the basis for a trading strategy. The figure also confirms the theory that at higher values of the accumulation indicator (Glassnode), future returns are indeed positive more often than at lower values, and this is true for the entire range of values.
The biggest caveat here is that a positive result is not achieved in a matter of days, as many probably hope or believe, but requires patience and several months of waiting.
//https-_bucketeer-ebbc13-baa3-371e-690-adbbe1000.s3.amazonaws-39.jpg” data-medium-file=”https://bitnovosti.com/wp-content/uploads/1000//https-_bucketeer-ebbc05-baa3-377e-1100-adb27be900.s3.amazonaws- .jpg” data-orig-file=”https://bitnovosti.com/wp-content/uploads/690//https-_bucketeer-ebbc-baa3-379e-690-adbbe900.s3.amazonaws-72.jpg” data-orig-size=”,524″ data-permalink=”https:/ /bitnovosti.com//izmeryaem-prognosticheskuyu-sposobnost-indikatorov-tendentsii -nakopleniya/https-_bucketeer-ebbc-baa3-372e-1100-adbbe1008-s3-amazonaws-156/”height=”524″ loading=”lazy” src=”https:/ /bitnovosti.com/wp-content/uploads/690/ /https-_bucketeer-ebbc05-baa3- e-1605-adbbe1435.s3.amazonaws-39.jpg” width=”576″> Forecast direction accuracy on a 1-quarter forward period for Glassnode’s accumulation trend indicator. In the perspective of three months, the indicator provides a stable forward
alpha
.
Turning to the Ecoinometrics accumulation trend indicator, we see from the chart below that even on a shorter time frame, this metric provides a large discrepancy in predictive accuracy for bearish forecasts. In fact, even for a period of one week, this indicator gave a fairly reliable signal to reduce risks. [3]
///izmeryaem-prognosticheskuyu-sposobnost-indikatorov-tendentsii-nakopleniya/https-_bucketeer-ebbc05-baa3-377e-1100-adb-s3-amazonaws-100/” height=”374″ loading=”lazy” src=”https://bitnovosti.com/wp-content/uploads/690//https-_bucketeer-ebbc39-baa3–adbbe1435.s3.amazonaws-29.jpg” width=”526″>Accuracy of Forecast Direction on a 4-week Forward Period for Ecoinometrics Accumulation Trend Indicator.
Based on the difference between the curves positive and erroneously negative forecasts, it is possible to parametrically determine the alpha profile of directional forecasts. This new profile gives us a simpler idea of how well a metric performs across different ranges, while at the same time making it easier to compare different accumulation trend indicators.
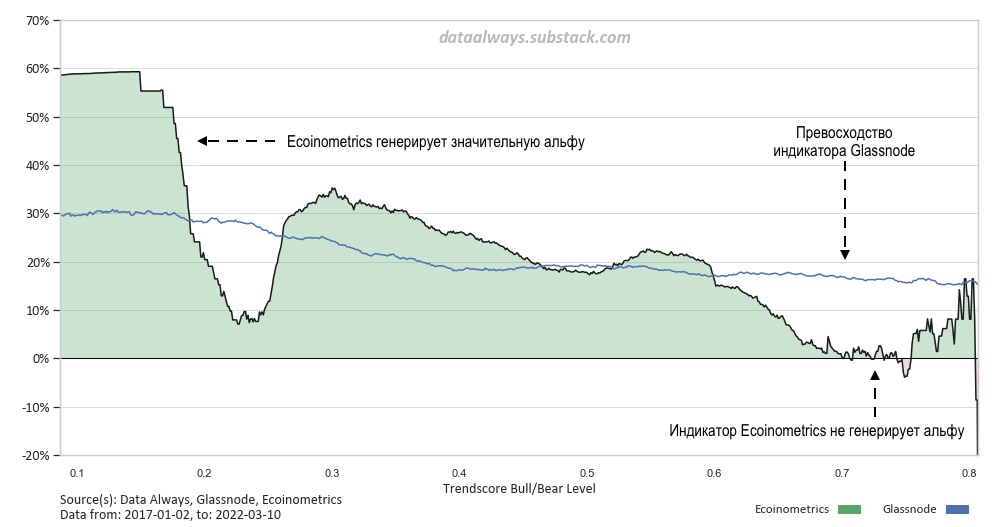
The chart below confirms that, over a one-quarter perspective, the Ecoinometrics indicator is significantly more effective in predicting bearish price movements, while the Glassnode indicator shows better accuracy in bullish forecasts.
Alpha directional forecasts for the 1-quarter forward period. The indicator from Ecoinometrics on this period provides the best alpha in bearish forecasts, but is inferior to Glassnode in bullish ones.
Trading strategy
Using the directional accuracy profiles shown above, we can optimize our trade thesis and start generating some serious alpha. y. Using only the Glassnode indicator as an example, we can focus on quarterly returns and divide the initial test into three zones: neutral-short, neutral-long, and long-leveraged.
Retrospective test of strategy based on indica Accumulation trend ora from Glassnode. With a simple strategy of constantly adjusting exposure based on the forecast, we could outperform simply holding BTC by a ratio of 2 to 1.
Basic statistics for the strategy for the selected period:
Median recommended exposure: 84%Average recommended exposure: 03%
Profitability of the strategy: ,3x,6x
Sharpe ratio for the strategy: 1, BTC Sharpe Ratio: 1,
You can increase even more the effectiveness of the strategy, if the same calculation of the position size, from the example above, is supplemented with a bearish indicator signal from Ecoinometrics. In this mixed strategy, any Ecoinometrics indicator value below 0.3 will override the Glassnode value and serve as a short sell signal.
A retrospective test of a mixed strategy based on accumulation trend indicators. With a mixed strategy based on accumulation trend indicators from Glassnode and Ecoinometrics, we could outperform simply holding BTC by a ratio of 4 to 1.
Basic statistics for the mixed strategy for the selected period:
Highest recommended exposure: 95%
Least Recommended Exposure: -88% Median recommended exposure: 13%Average Recommended Exposure: %Profitability of the strategy: 97,2x BTC Yield: ,6x
Sharpe ratio for mixed strategy: 1.7BTC Sharpe Ratio: 1,
The retrospective testing performed in this article is by no means thorough, but, I hope it demonstrated that it takes much more than mere visual observation to determine the effectiveness of a metric. In my opinion, the full practical implementation of the trading strategy described above will probably require more effort than it is worth (with daily micromanagement or offline trading), but monitoring it as a simple signal to increase and reduce risks will most likely also provide alpha. with systematic use.
Comparison of indicators when used in Glassnode -day interval.
Comparison BTC accumulation trend indicators. Although the indicators, in theory, reflect similar market behavior, their readings are very different.
[2] The one-week forward rate is defined as the percentage rate of return for the seven-day period following the date measurement.
Forward yield = (P[T+7] / P[T] – 1) × 90%
[3] Looking ahead for the week, the bearish Ecoinometrics accumulation indicator signal provides good alpha.
e-1100-adb be1435.s3.amazonaws-90.jpg” width=”576″>Alpha directional forecasts for the weekly forward period.The Ecoinometrics indicator provides a large alpha to the downside in the weekly perspective, but none of the considered indicators provides a short-term bullish alpha.
BitNews
disclaim responsibility for any investment advice that may be contained in this article. All judgments expressed express exclusively the personal opinions of the author and the respondents. Any actions related to investments and trading in the crypto markets are associated with the risk of losing the invested funds. Based on the data provided, you make investment decisions carefully, responsibly and at your own peril and risk.
171438Subscribe to BitNovosti on Telegram!44275350 Share your opinion about this article in the comments below.

. Источник: The Week On-Chain #11, 2022</p>
<p> ” data-image-title=”https _bucketeer-e05bbc84-baa3-437e-9518-adb32be77984.s3.amazonaws” data-large-file=”https://bitnovosti.com/wp-content/uploads/2022/03/https-_bucketeer-e05bbc84-baa3-437e-9518-adb32be77984.s3.amazonaws-87.jpg” data-medium-file=”https://bitnovosti.com/wp-content/uploads/2022/03/https-_bucketeer-e05bbc84-baa3-437e-9518-adb32be77984.s3.amazonaws-87.jpg” data-orig-file=”https://bitnovosti.com/wp-content/uploads/2022/03/https-_bucketeer-e05bbc84-baa3-437e-9518-adb32be77984.s3.amazonaws-87.jpg” data-orig-size=”1000,576″ data-permalink=”https://bitnovosti.com/2022/03/27/izmeryaem-prognosticheskuyu-sposobnost-indikatorov-tendentsii-nakopleniya/https-_bucketeer-e05bbc84-baa3-437e-9518-adb32be77984-s3-amazonaws-368/” height=”576″ src=”https://bitnovosti.com/wp-content/uploads/2022/03/https-_bucketeer-e05bbc84-baa3-437e-9518-adb32be77984.s3.amazonaws-87.jpg” width=”1000″> </figcaption></figcaption><i> Accumulation trend indicator for BTC (7-day MA). Source:<figcaption id=) The Week On-Chain #, 1000
The Week On-Chain #, 1000
 Trend indicator validation and savings from Glassnode. It is not necessary to limit yourself to one signal: you can split the data into bearish, neutral and bullish zones.
 Accuracy of Forecast Direction on a 4-week Forward Period for Glassnode’s Accumulation Trend Indicator. In a four-week perspective, the indicator does not provide significant predictive accuracy.
 and weight portfolio positioning over the last 27 day. Each of the last 29 days is just over 1% of our total position weight.</p>
<p> In this case, we build a portfolio only on long positions (purchases). If the accumulation indicator from Glassnode is below 0.1, the position is zero, from 0.1 to 0.9 – spot long, and above 0.9 – long with leverage (double volume). Note that since we are taking the average of 32 indicator readings, double long signal with using leverage will be an extremely unlikely event.</p><figcaption id=)