
What you need to know about BTC and LTC price charts here and now.
 Weekly schedule
The weekly chart still looks bullish, but it’s too early to judge the current candle before it closes. The last two weeks have so far filled the fuses of the previous few weeks, showing that these were more like test pumps than a strong bearish reaction pushing the price lower. Above is strong resistance ~$45,5 thousand — key horizontal level coinciding with 16 MA.
Don’t be overly optimistic in the face of resistance! Please be patient.
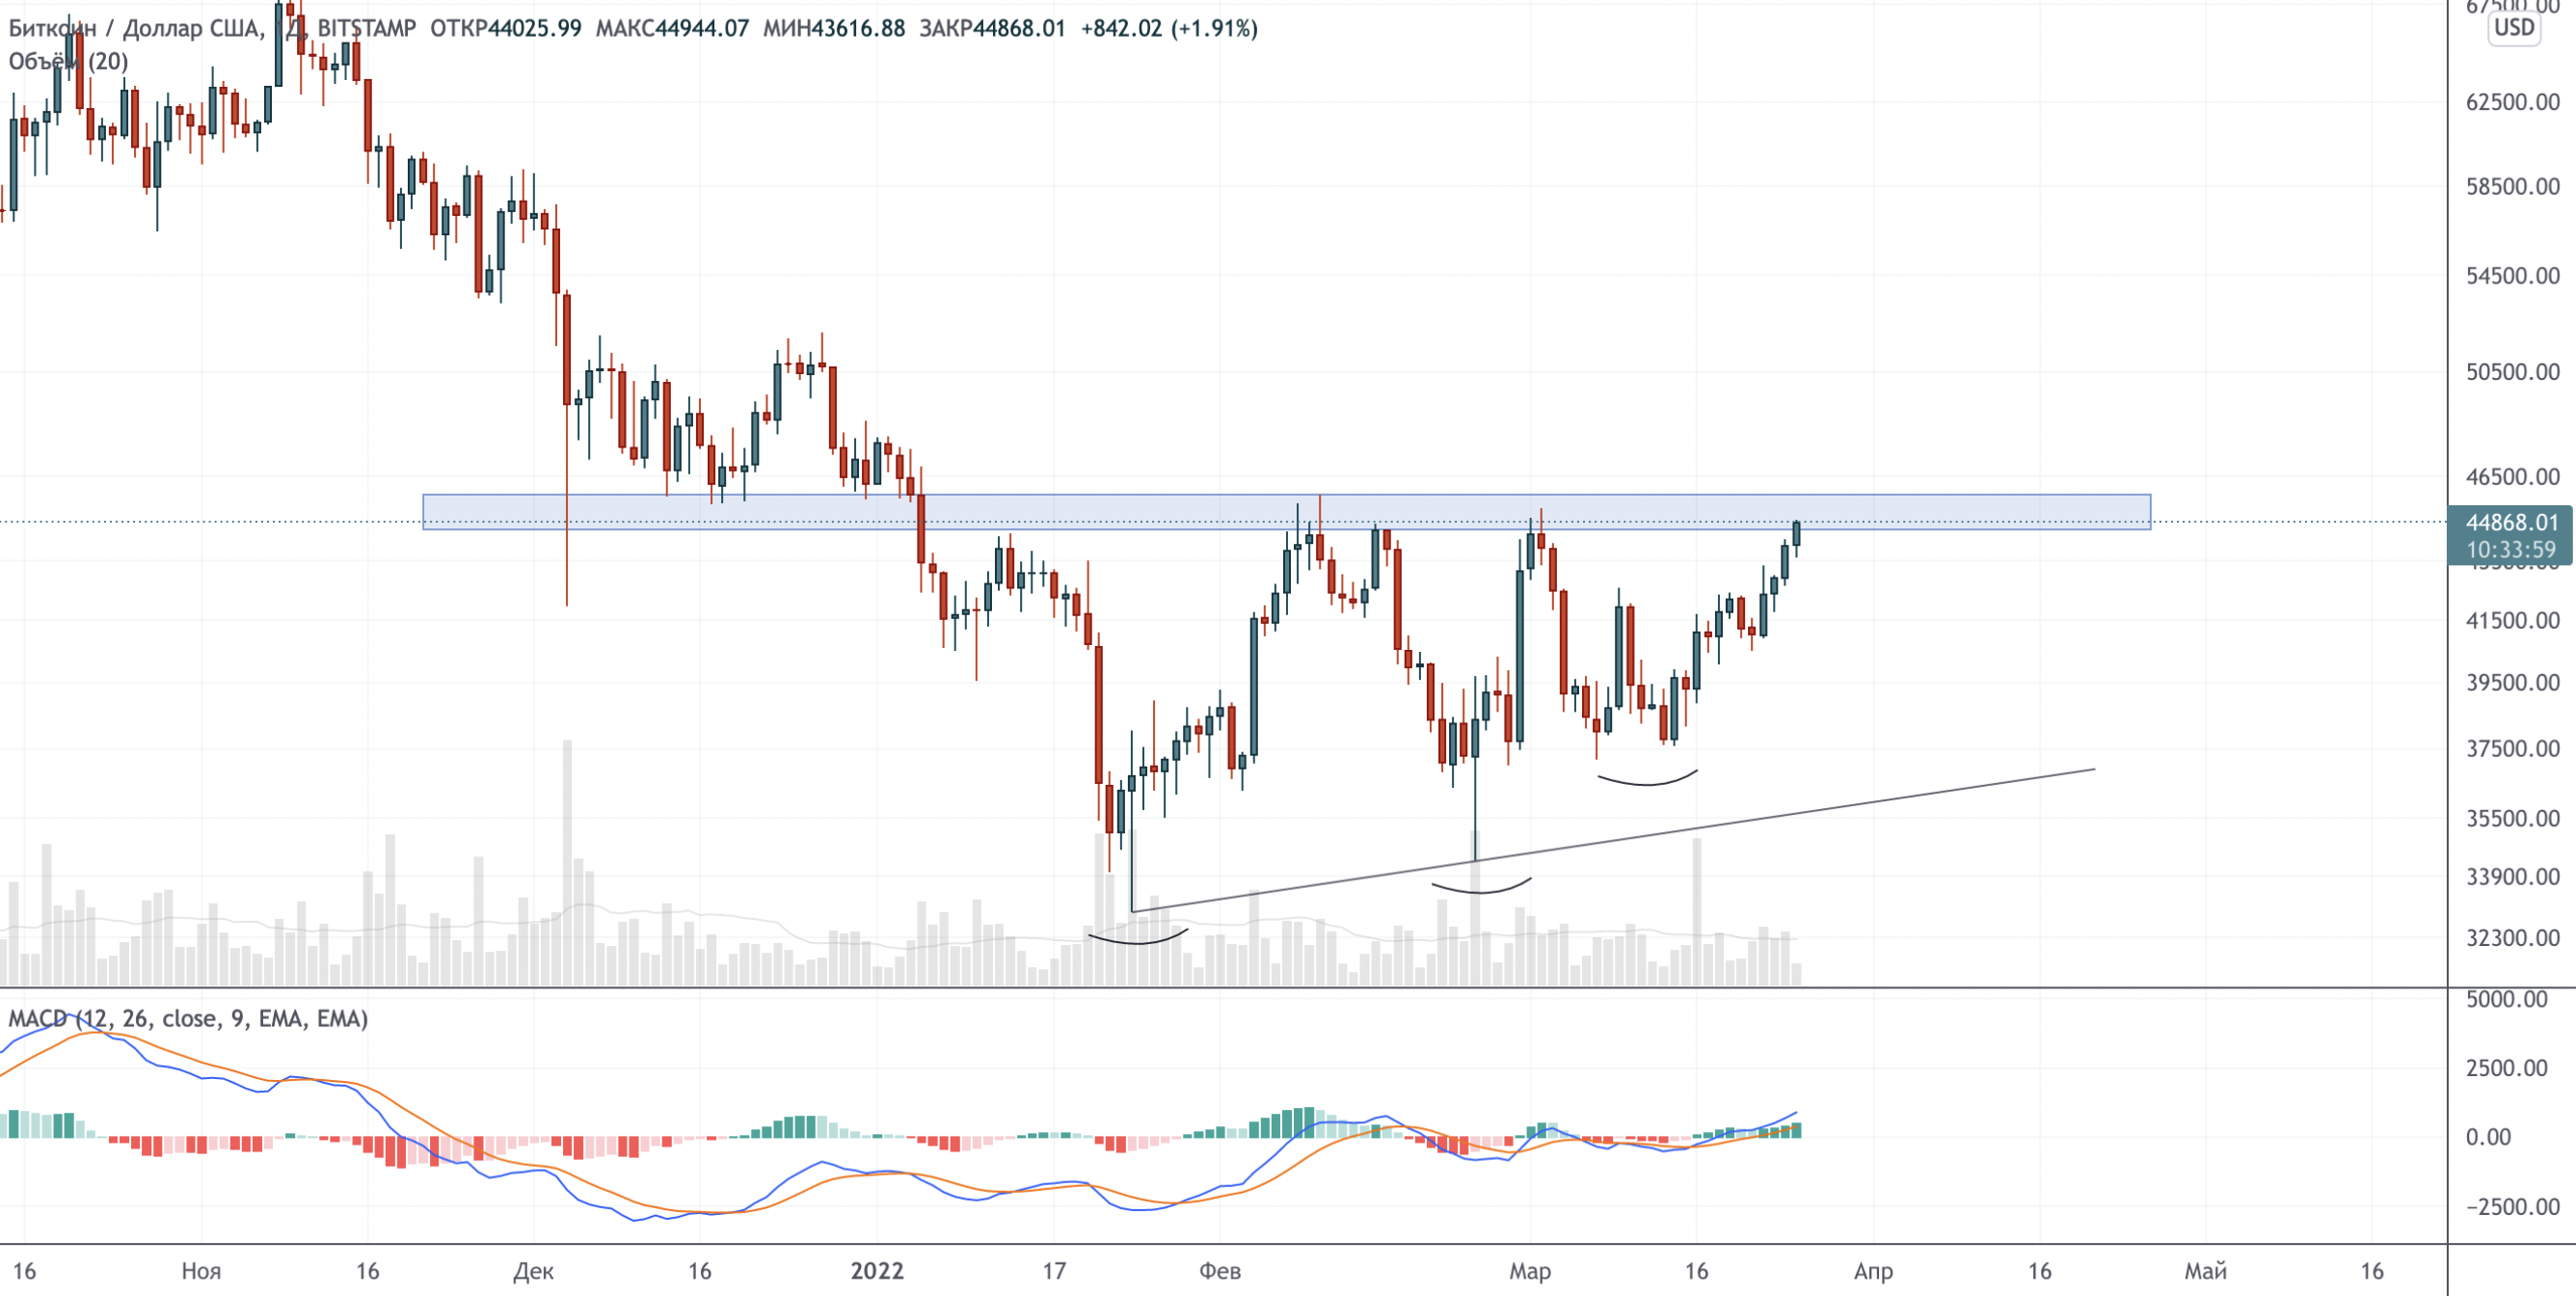
Daily

In my opinion, traders should not get too hung up on the lines, rather, it is better to perceive them as areas of interest. Therefore, I removed everything that could distract attention from the daily chart, and displayed the upper border of the potential ascending triangle as a rather wide zone instead of a simple line. As you can see, price continues to make bigger highs, consolidating under this horizontal resistance. This usually means that buying pressure is building up and eventually the resistance will be breached. Resistance in this area is visible on almost every timeframe.
Weekend promises to be interesting.
Altcoins
LTC/USD
Litecoin is at an interesting point. On the left side of the chart, the price has formed a falling wedge. This is a bullish pattern offering a couple of possible buy setups – in this case a reversal around $110 and a breakout of the upper limit, and this idea then worked out up to the supply zone near $144.
Now the chart is forming a similar figure, although it must be said that the market is rather unstable, and trading on it is objectively not easy.
Depending on how to draw a descending line, the price either broke through this sloping resistance, or is exactly at its level. As for me, I would prefer to buy on the retest area $25 as support and then expect to see a clear breakout on good volume. Is there a risk of missing out on a deal? Certainly! But is it worth worrying about? There will always be another possibility. The price from this point can break through the resistance and go vertically up. Or she can test $25, and this support will not work, but in this case, you will at least have a small distance to the stop loss (read: good risk / reward ratio) and a certain controllable loss.
All current the move was preceded by a bullish divergence with the RSI. The indicator has not reached the “overbought” zone yet, so I think that we can expect another strong move up. The nearest target level is only $144. Upon reaching it, it will be possible to re-evaluate the situation and adjust expectations.
The main thing to remember: if I (or you, or anyone) drew lines on the chart, this does not mean that the price will now move in accordance with them . These are just some individually defined criteria to help (1) manage risk and (2) anticipate some triggers and based on them imagine one or more possible courses of action depending on how the situation actually develops.
BitNews disclaim responsibility for any investment advice that may be contained in this article. All judgments expressed express exclusively the personal opinions of the author and the respondents. Any actions related to investments and trading in the crypto markets are associated with the risk of losing the invested funds. Based on the data provided, you make investment decisions carefully, responsibly and at your own peril and risk.
Subscribe to BitNovosti on Telegram!171382 Share your opinion about this article in the comments below.